THE UK UNIVERSITY ESTATES BENCHMARK 2026
Fixed estate. Tighter budgets. Harder choices.
Cost, space, energy and carbon across 125 HESA-reporting higher education providers
Foreword
We work on university campuses every day, and for the past two years we have heard the same conversation in different accents: the estate is largely fixed, financial headroom is tighter for many institutions, and the choices are getting harder.
This report puts numbers on that conversation. It draws entirely on data universities report to HESA, and no institution is named. Three things stand out.
First, how much estates teams have already delivered. Over the past decade a matched panel of providers absorbed 19% more students into an estate that grew by only about 10%, while cutting energy use and reducing carbon emissions by more than a third. That is a substantial operational achievement, and one that deserves greater recognition.
Second, cost pressure. In the latest year, reported premises operating expenditure fell in real terms: staff costs rose while other operating expenses fell. The data cannot say how much of that was efficiency and how much was work delayed, but that distinction, between cost genuinely removed and cost pushed into the future, is the one estates leaders most need to weigh.
Third, variation. Even between universities in the same region, the cost of running a square metre of campus differs widely. Some of that is buildings, mission and accounting; some reflects how the estate is operated, and that is where the most useful questions begin.
This is not a league table. Reported cost tells you where to look, not what to conclude, and responsible decisions need more context than accounts alone can give. The estate is largely fixed and financial headroom is tighter, so the task is rarely about cost alone: it is to contain cost and show value while protecting the safe, compliant, reliable and welcoming campuses the institution depends on.
A confidential benchmark of your institution’s position is available on request.

James Gates, Managing Director, Bidvest Noonan
About the Data
All figures are drawn from HESA open data: the Estates Management record (estates, energy, emissions, space and buildings) and the Finance record (premises operating expenditure and income). The data was downloaded on 11 July 2026 and reflects the most recent figures available at that time; the latest complete reporting year is 2024/25.
The benchmark covers 125 higher education providers that meet two thresholds, more than 1,000 m² of non-residential estate and more than 500 student full-time equivalent (FTE), and have sufficiently complete data. Three panels are used: the full 125 for current-year benchmarking; a matched panel of 120 providers with complete data in both of the latest two years for year-on-year change; and a matched panel of 95 providers reporting in every year since 2015/16 for the ten-year trends. Cost per square metre uses non-residential floor area and excludes depreciation, amortisation and interest. Fuller definitions are in the appendix. A detailed calculation register is available separately.
Cost Pressure: What the Expenditure Data Shows
In 2024/25, the latest available HESA reporting year, across a matched panel of 120 HE providers with complete data in both years, reported premises operating expenditure (staff plus other operating expenses, excluding depreciation and finance charges) fell 1.6% in cash terms; against prevailing inflation, that is a larger reduction in real terms.
The movement was not evenly spread:
| Component of premises operating expenditure | Change 2023/24 to 2024/25 (cash terms) |
|---|---|
| Premises staff costs | +4.2% |
| Other operating expenses | −3.3% |
| Total operating expenditure | −1.6% |
Together, those two lines are the whole of premises operating expenditure: staff costs cover directly employed premises staff, while other operating expenses is the broad category containing energy, rates, insurance, materials, repairs and bought-in services.
Set against income, the pressure is clearer still. Across the matched panel, aggregate income rose 2.3% in cash terms while premises operating expenditure fell 1.6%, so premises spending slipped from 8.2% to 7.9% of income. Income rose modestly in cash terms while spending on the estate fell.
The movement varied by geography. Within the 125-provider benchmark population, reported premises operating expenditure fell in cash terms in eight of the eleven regions compared, led by the South West (−11.0%), the North West (−7.4%) and Wales (−6.5%). London stood apart, up 4.0%. (Regional samples are small; Northern Ireland, with three providers, is excluded.) A wider group of around 250 providers reporting in both years, including many smaller and specialist institutions, showed a shallower fall. The direction is consistent across populations, though the decline is larger within the matched benchmark panel.
The Read From:
Mairead Stapleton, Senior Business Development Director, Education
Estates budgets are under downward pressure. That is my read of this year’s data, and the reasons sit in plain sight: income rose only modestly in cash terms, student numbers fell, and pay costs rose, while both other operating expenses and total premises expenditure came down. Some of that reduction may be genuine efficiency, better procurement, cheaper energy, smarter working, and where it is, it deserves credit. But a falling number can also mean cutbacks or deferred work, and the published figures cannot tell you which; only an institution’s own records can. If your services budget is shrinking, the useful question is not ‘how do we cut more’ but ‘which pounds are still buying value’.
Perspective On: Resourcing the Estate
When budgets tighten, the quickest move is to take an equal percentage off every line. In my experience it rarely holds up, because it takes just as much from the services that protect the estate as from those with room to give. The better starting point is the estate itself: what does each building actually need, where, when and to what standard, and how can that be delivered with better productivity rates and data-driven cleaning? The obligations stay the same; what changes is that they are resourced against evidence and science rather than habit.
That starts with what the estate is already telling you. Most sites generate far more data than they use: planned and reactive maintenance histories, energy metering, BMS, helpdesk logs and, increasingly, occupancy data. Read together, these show where labour, energy and money genuinely go, and in my experience it is rarely where the standing schedules assume. Looking after one of the largest estates in Wales, and one of the oldest universities in the UK, I have seen how differently a modern portfolio and a historic one behave, yet both reward the same discipline. Resourcing built on that evidence holds the same standards for less input: cleaning specifications that follow actual use rather than a fixed frequency, engineering effort weighted towards the assets that carry real compliance and continuity risk, heating and ventilation matched to occupancy.
Automation deserves to be judged on the same basis. Across large floor areas and repetitive tasks it can shift the economics, giving consistent output, work done off-peak, a continuous record of what has been covered, and skilled staff freed up for tasks that need judgement. In my experience the test is not whether it is new. It is whether it holds standards and resilience at a lower running cost, and whether the operation around it, the supervision, the data, the specification, is set up to make use of it.
The distinction that matters is between removing effort and removing cover. Standing a service down is the cheapest change on the table and, from what I have seen, sometimes the most expensive an estate ever makes, because the cost comes back later as backlog, breakdown or a compliance gap. Savings that last are the ones that hold the outcome, a safe, clean, compliant, available building, and change how the work behind it is resourced.
— Muhammad Amin Choudhry, Key Account Director, Higher Education, Bidvest Noonan
A practitioner perspective. The views here are the author’s professional opinion, offered to prompt discussion; they are not findings of the HESA data
The Benchmarks: Reported Cost Intensity
The benchmarks compare premises operating cost per square metre of non-residential estate across the 125 providers meeting the benchmark criteria, using the latest reported year. No institution is identified; positions are shown as regional and size-band quartiles. Full definitions and exclusions are in the appendix.
| Region | Providers | Lower quartile (£/m²) | Median (£/m²) | Upper quartile (£/m²) | Median £ per student FTE |
|---|---|---|---|---|---|
| London | 25 | 185 | 209 | 256 | 1,757 |
| South West | 10 | 134 | 168 | 201 | 1,553 |
| North East * | 5 | 160 | 167 | 172 | 1,292 |
| East of England * | 9 | 124 | 164 | 174 | 1,352 |
| South East | 13 | 143 | 164 | 204 | 1,424 |
| North West | 10 | 135 | 153 | 164 | 1,372 |
| West Midlands | 10 | 135 | 144 | 169 | 1,323 |
| Scotland | 15 | 110 | 136 | 180 | 1,793 |
| East Midlands * | 7 | 117 | 127 | 136 | 1,338 |
| Yorkshire and The Humber | 10 | 111 | 124 | 130 | 1,358 |
| Wales * | 8 | 90 | 122 | 134 | 1,369 |
| Northern Ireland ** | 3 | – | . | . | – |
The Providers column sums to the 125 benchmark providers in total. Northern Ireland (3 providers) is shown for completeness but its values are suppressed and excluded from the variance calculations. * Small sample (fewer than ten providers). ** Values suppressed (fewer than five providers); included in provider counts only, and excluded from the variance calculations.
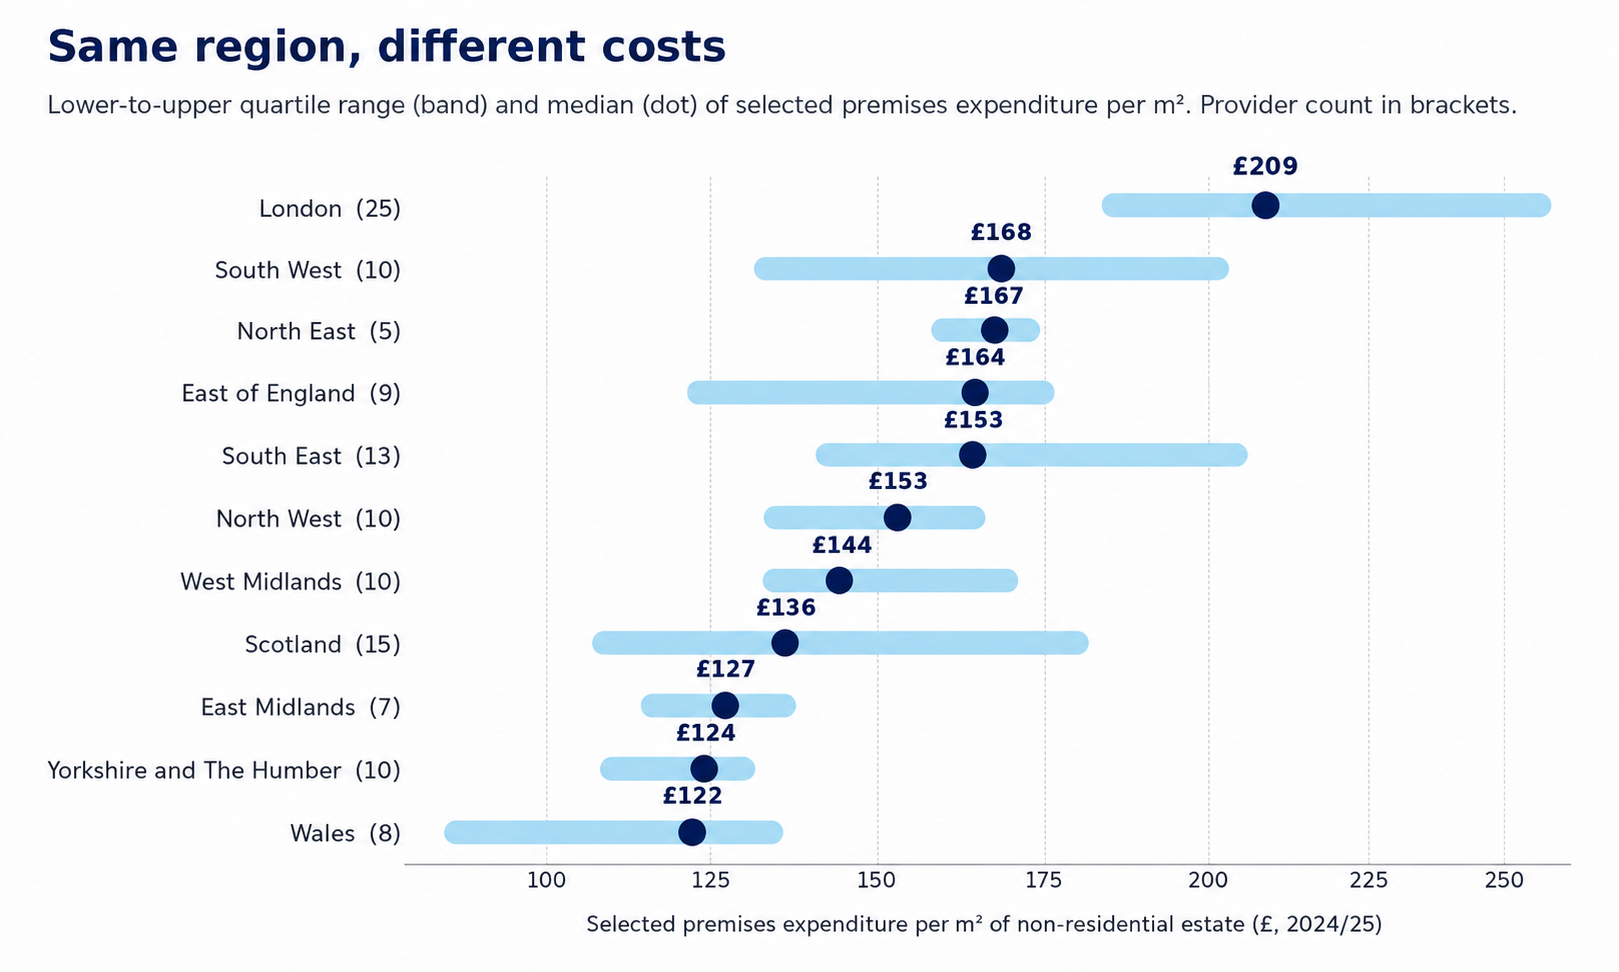
Source: HESA Estates Management and Finance records (downloaded 11 July 2026); 125 benchmark providers, 2024/25. Regions with fewer than five providers are excluded.
Two findings stand out. First, London reports the highest cost intensity, a median of £209/m² against £141 across the rest of the UK. Second, even within the same regions, reported cost intensity varies substantially: in most regions, the upper-quartile cost intensity is 20-60% higher than the lower quartile, despite providers operating within the same broad regional cost environment. Geography alone does not explain reported cost intensity; estate composition, institutional activity, service requirements and accounting practice are also likely to matter. That is precisely why comparing your own institution against properly comparable peers, rather than the sector average, is worth doing.
By size
| Student FTE | Providers | Lower quartile (£/m²) | Median (£/m²) | Upper quartile (£/m²) |
|---|---|---|---|---|
| Under 5,000 | 21 | 114 | 148 | 185 |
| 5,000-10,000 | 17 | 103 | 138 | 149 |
| 10,000-20,000 | 52 | 125 | 144 | 186 |
| 20,000-40,000 | 33 | 145 | 172 | 208 |
Scale does not appear to bring lower reported costs: the largest size band shown reports the highest median cost per square metre, £172 against £138–148 in the smaller bands. The complexity of large, research-intensive and often London-based estates may offset some of the economies scale might otherwise bring. (The two largest institutions, over 40,000 students, are excluded as a sample of two.)
The scale of the variance
These are descriptive measures of how widely reported costs are spread, not estimates of waste or of savings any institution could bank. What they demonstrate is scale: differences of this size are worth examining institution by institution to understand what drives them.
The Read From:
Mairead Stapleton, Senior Business Development Director, Education
The gap inside regions matters more than the gap between them. Providers facing broadly the same labour market and property costs report cost intensities 20 to 60% apart, and that spread is wider than the difference between most regions. Some of it is structural: laboratories, heritage buildings and dispersed sites cost more to run wherever they are, and much of London’s premium will reflect labour, rates, density and building mix. Some reflects chosen service levels, and a low figure is not automatically a good one; it can mean under-investment as well as efficiency. What remains, once those explanations are exhausted, is how the estate is operated, and that is where the most useful conversations are. Find your region’s row, see which side of the median you sit on, and ask what explains it.
Perspective On: Cost Variation
The variation this report finds, cost per square metre differing widely even between neighbours in the same region, is real, but it is the beginning of an investigation, not the end of one. A cost-intensity figure tells you where an estate sits. It tells you nothing, on its own, about why, and the why is where every useful decision lives. I have seen two universities with almost identical cost per square metre running completely different operations: one lean and quietly under-invested, storing up trouble; the other well-resourced but poorly coordinated, spending more than it needed to for a good result. The same number, opposite problems.
When an estate looks more expensive than its peers, the first move is not to defend the number or to be concerned by it, but to take it apart. How much of the difference is structural and fixed, laboratory and specialist space, heritage buildings, a dispersed set of sites, longer operating hours? How much is service scope, a higher specification the institution has chosen and values? And how much is operational, the part that deployment, coordination and better evidence could change? Only the last of those is a cost problem; the first is context and the second is a deliberate choice, and treating either as waste is how benchmarking earns its bad name.
The question people most often skip is the simplest: what is this cost buying us? A high figure on a research-intensive estate may be buying exactly the resilience and performance that estate needs, in which case it is money well spent and the benchmark’s job is to confirm that, not to challenge it. The point of a comparison is not to drive every institution toward the median. It is to help a team understand its own position well enough to defend it to finance, or to change it on purpose.
Used well, a benchmark is a diagnostic. Used badly, it becomes a league table that punishes complexity and rewards under-investment, which helps no one. The difference is entirely in whether the reader stops at the number or starts there.
— Mairead Stapleton, Senior Business Development Director, Higher Education, Bidvest Noonan
A solution designer perspective. The views here are the author’s professional opinion, offered to prompt discussion; they are not findings of the HESA data
The Fixed Estate: Demand Moved, The Buildings Did Not
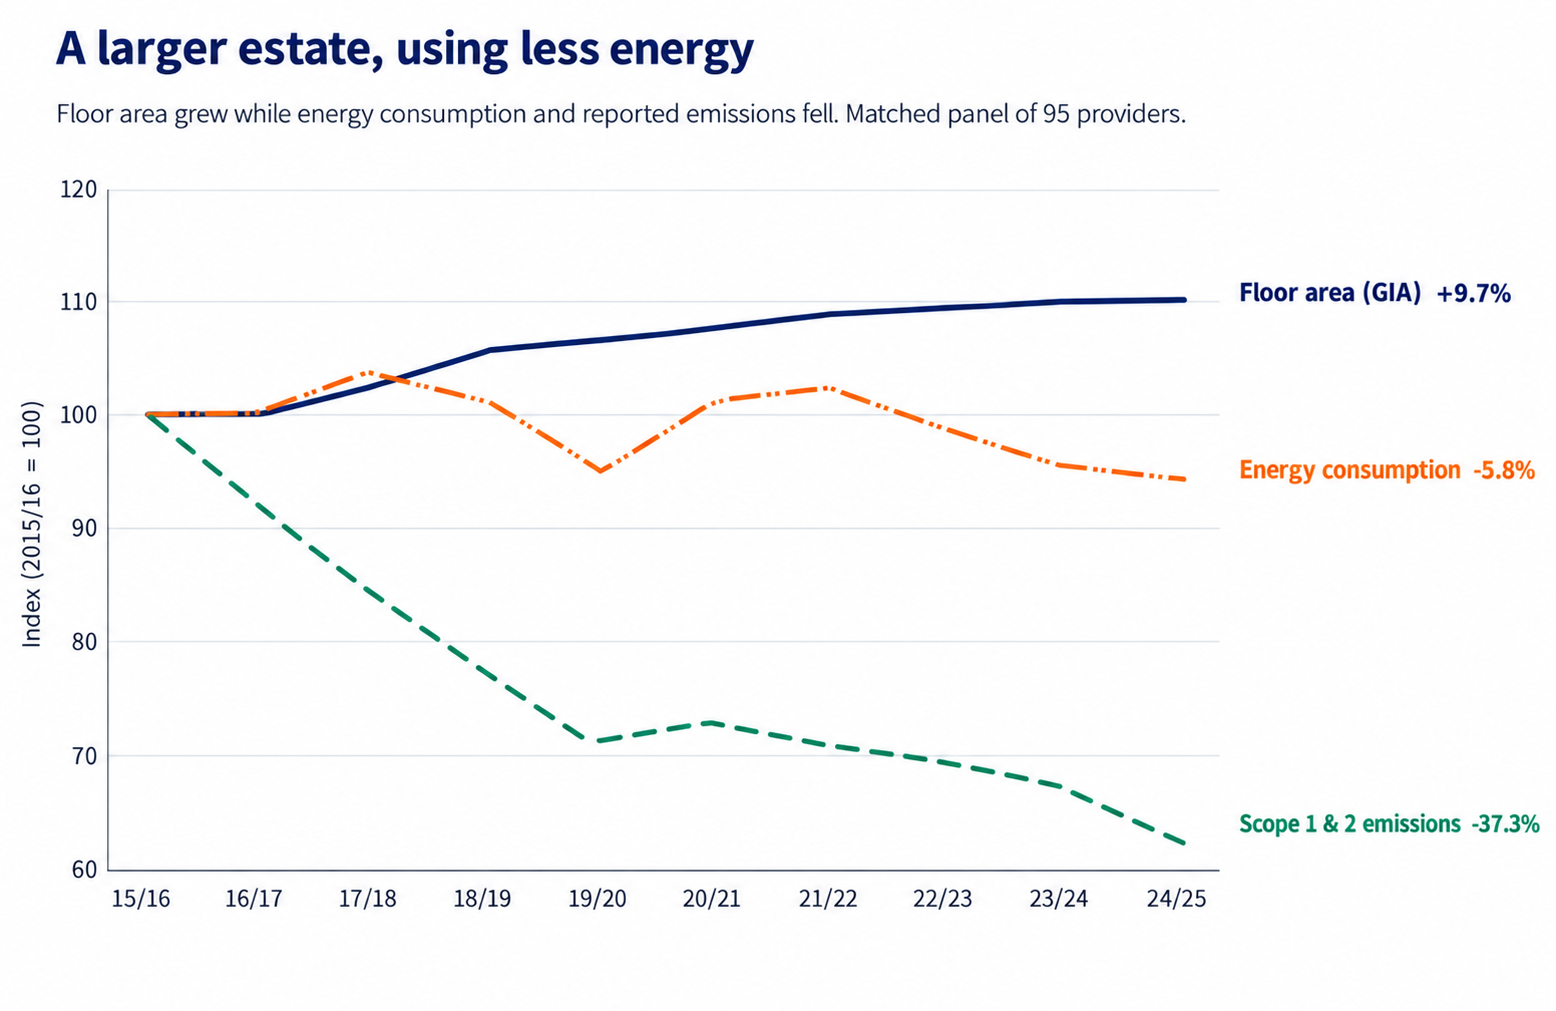
Between 2015/16 and 2024/25, on a matched panel of 95 providers reporting every measure in every year, student FTE rose 19% and reported nominal income rose 54%. The estate grew just 10%, and has barely grown at all since 2022. Student numbers then peaked in 2022/23 and have fallen for two consecutive years, while the estate has not moved.

Source: HESA Estates Management record open data (downloaded 11 July 2026); matched panel of 95 providers reporting all measures in every year.
As the chart shows, the climb in student numbers to 2022/23 reflects a rising population of UK 18-year-olds and, especially in the later years, strong international recruitment; sector-wide student data indicates that much of the recent decline has been concentrated in international enrolments, which fell following changes to student-visa rules and amid wider financial caution. The energy line dips sharply in 2019/20, when campuses closed for the final months of that academic year, recovers through reopening (enhanced ventilation under COVID guidance worked against efficiency), and then falls steadily from 2022/23 as the energy price shock made consumption a board-level issue. The emissions line falls faster than energy throughout because it also carries the decarbonisation of the electricity grid alongside estates’ own work on heating, controls and fabric. These readings are our interpretation of the pattern; the data itself records the outcomes.
What happens next matters for every space plan, and the near-term signals point in different directions. The UK 18-year-old population is projected to keep growing to the end of the decade, from about 856,000 in 2026 to about 876,000 in 2030 (ONS, 2024-based projections), which gives some support to domestic demand. But a larger cohort does not guarantee more enrolments: participation, affordability, policy and alternative routes all shape the outcome. International enrolments, meanwhile, have fallen following changes to student-visa rules. Demand is therefore not simply falling; its composition is shifting between international and domestic students, which changes who is on campus and what space they need as much as how many. But the structural point holds in every scenario: an estate’s obligations do not scale down with enrolment in the short term. Space, compliance, heating, cleaning, security and maintenance are stepped costs attached to buildings, not to students, and the buildings are still there.
The Read From:
Mairead Stapleton, Senior Business Development Director, Education
Estates teams absorbed a decade of growth without a building boom, which is why space per student declined for seven consecutive years. In the last two years the direction has changed: the estate has not significantly expanded, but demand has softened. Whether student numbers recover or keep drifting, the estate still needs to be heated, maintained and kept safe, so the pressure is now on how each square metre is used and operated. That is where the next round of decisions will be made.
Perspective On: The Fixed Estate
The data in this report describes something most estates teams already feel: the scale of the estate largely stays the same while the demand on it moves. Student numbers rise and then soften, timetables shift, whole departments change how they work, but the floor area, and the cost of heating, cleaning, securing and maintaining it, barely moves with them. The instinct when budgets tighten is to trim a bit off everything. In my experience that is the least effective response available, because it spreads reductions across space that is working hard and space that is barely used alike.
The more useful question is narrower: where is this estate actually used, and when? A campus is never occupied evenly. Teaching space, laboratories, libraries and social areas fill and empty on completely different rhythms, and a surprising amount of service effort is still scheduled against a timetable of assumptions rather than evidence of use. When a team can see actual occupancy, building by building and hour by hour, the conversation changes from “what can we cut” to “what can we match.” Cleaning can follow use rather than a fixed weekly grid; security presence can concentrate where and when it is needed; heating and ventilation can stop running full-tilt in half-empty buildings out of hours.
This is where occupancy sensing earns its place, but only if the organisation is willing to act on what it shows. I have seen universities install a great deal of monitoring and then change nothing, because the service specifications and the contracts underneath them were fixed. Data that no one is allowed to act on is just cost. The value is not in the sensor; it is in the decision the sensor makes possible, and in a service model flexible enough to respond.
A word of caution. A building that looks lightly used is not necessarily a building that can be run down. Some low-occupancy space is critical, a specialist facility, a resilience requirement, a room that matters enormously for the few hours it is needed. The skill is not switching things off; it is distinguishing genuinely surplus provision from provision that is simply intermittent. That judgement is the job. The data informs it; it does not make it.
— Peter Smyth, Director of Technology & Innovation, Bidvest Noonan
A strategic innovator perspective. The views here are the author’s professional opinion, offered to prompt discussion; they are not findings of the HESA data
Energy and Carbon: A Decade of Measurable Progress
Amid the financial pressure, the sector’s reported environmental performance has improved markedly.
Across the matched panel of 95 providers, total energy consumption fell 6% in absolute terms while the estate grew 10%, taking energy intensity from 263 to 226 kWh/m², and reported scope 1 and 2 emissions fell 37%. The reduction reflects substantial grid decarbonisation and is also consistent with improvements in estate operation and investment. Water consumption fell 14% across 116 matched providers. Renewable generation roughly tripled over the decade across 87 providers with complete ten-year returns; among 112 benchmark providers reporting the measure in both of the latest two years, generation grew 17%.
The carbon challenge is moving from electricity to heat
Decomposing the same panel by fuel sharpens the picture considerably. Grid-electricity emissions fell 60% over the decade, driven substantially by the decarbonisation of the grid itself; natural-gas emissions fell by less than 1%, because gas consumption barely moved (−0.3%, including gas used in on-site CHP). The grid-electricity component accounted for roughly 95% of the matched panel’s reported reduction in scope 1 and 2 emissions. As a result, gas supplied 59% of the panel’s energy in the latest reported year, up from 56% a decade earlier, and accounted for 56% of scope 1 and 2 emissions, up from 36%, while grid electricity’s share of emissions fell from 59% to 38%.
Universities have banked the cleaner-grid dividend while containing energy demand across a growing estate; that is a real achievement. But the arithmetic of the next stage is different: what remains is predominantly heat, and heat sits inside the buildings themselves, in boilers, plant, controls, distribution and fabric.

Source: HESA Estates Management record open data (downloaded 11 July 2026); matched panel of 86 providers reporting rated floor area in both years.
The energy-rating data points the same way. Among the 108 benchmark providers reporting complete non-residential DEC or EPC band data in the latest reported year, rated space covers roughly 78% of their non-residential estate; of that rated area, 42% (about 6.5 million m²) remains in bands D to G, including 13% (about 2.0 million m²) in F and G. The direction of travel is right, as the chart shows: on an 86-provider matched panel, band A-C space has grown from 45% to 58% of rated area over the decade. But more than two-fifths of rated space in the lower bands helps explain why the next stage of energy and carbon reduction is likely to require more than operational measures alone. (These figures describe rated area only, not the entire estate.)
The caveat matters as much as the achievement: among the 117 benchmark providers reporting both renewable generation and energy consumption, aggregate generation still equals just 2% of aggregate consumption. Further reductions are likely to depend increasingly on heat decarbonisation and improvements to older buildings, areas that often require capital investment as well as operational change, at a time when capital is scarce. Providers that treat energy, maintenance and space planning as a single problem are likely to be best placed for the next stage.
The Read From:
Mairead Stapleton, Senior Business Development Director, Education
Look at one number: across the matched panel, 95% of the carbon reduction came from the electricity grid getting cleaner. Gas, which is mostly heating, has barely moved in ten years and now drives over half of campus emissions. Most of the saving from the cleaner grid has now been captured; what is left is heat in older buildings, and that will require substantially more capital and engineering, alongside continued operational improvement. The institutions that keep making progress from here will be the ones that stop treating the energy plan, the maintenance plan and the space plan as three different documents.
Perspective On: The Heat Challenge
One finding here is worth pausing on: almost all of the sector’s carbon reduction over the decade came from the electricity grid getting cleaner, while gas, which is mostly heating, barely moved. That is not a criticism of estates teams; the grid decarbonising is a real, banked achievement. But it means the easy, invisible progress is largely behind us. What remains is heat, sitting inside boilers, plant, distribution and building fabric, and it is expensive and disruptive to change. The temptation, with a net-zero date approaching, is to start buying equipment. In my experience that is exactly how money gets wasted.
The estates that will spend well on decarbonisation are the ones that understand their consumption before they commit capital. That means metering and reading energy building by building, so you know which buildings are actually the problem rather than assuming; and it means exhausting the operational gains first. A surprising share of early progress comes not from new plant but from running existing plant properly: correcting control schedules, fixing simultaneous heating and cooling, aligning run-times and ventilation with actual occupancy, repairing distribution. These changes are cheap relative to replacement, they deliver now, and they build the evidence base that makes the eventual capital case defensible.
Sequence matters enormously. Replacing a heat source without first addressing the fabric, the distribution temperatures and the controls around it often locks in a poor outcome at high cost. A building-by-building heat plan, one that distinguishes the straightforward conversions from the genuinely difficult specialist buildings, is worth more than a campus-wide assumption applied uniformly. Decarbonisation is a staged engineering programme, not a single purchase, and treating it as one is what keeps it affordable. It also builds the evidence a capital bid needs: metered consumption, building-level condition and a costed sequence are what turn a heat-decarbonisation case into something a finance director and governors will fund, and what Salix and similar funding routes expect to see.
The thing to be wary of is the green win that is not one, the intervention that looks good in a report but does not survive contact with how the building actually runs. The discipline that protects against it is the same one that protects against wasted capital everywhere: measure, verify, and connect the energy plan to the maintenance plan and the space plan rather than running all three separately.
— Aoife Kane, Director of Operations, Technical Services, Bidvest Noonan
A practitioner perspective. The views here are the author’s professional opinion, offered to prompt discussion; they are not findings of the HESA data
Five questions for your next estates conversation
This report is designed to be used, not just read. Five questions the data suggests every estates leadership team should be able to answer:
- Where does our reported cost per square metre sit against our region’s and size bracket’s quartiles, and do we understand why?
- What share of our premises budget is now committed to staff costs, and what does that imply for the non-staff budget over the next three years?
- Which activities were reduced, changed or deferred last year, and what future cost or operational risk follows?
- Is our space plan built on the student numbers we had in 2022 or the ones we expect in 2027?
- Which parts of our remaining carbon footprint can still be reduced operationally, and which now require capital, and is that boundary written down anywhere?

Appendices: Methodology & Technical Notes
Sources and Date
HESA open data, downloaded 11 July 2026: the Estates Management record open-data extract (estates, energy, emissions, students, income; academic years 2015/16 to 2024/25) and HESA Finance record Table 8 filtered to HESA cost centre 205 (Total premises) for 2023/24 and 2024/25. Contains HESA open data, licensed under the Creative Commons Attribution 4.0 International Licence. All calculations, groupings and interpretations are ours alone; HESA bears no responsibility for them and does not endorse this report. Figures reflect the HESA releases available on 11 July 2026; subsequent HESA updates may change sector totals and individual benchmarks. Interpretations, commentary and perspective boxes represent the professional views of the named individuals, not findings derived from the HESA data. They describe pressures and options that estates of particular kinds may wish to consider; they do not assert that the benchmark places any specific institution into any category or prescribes any course of action.
Context Sources
. Statements about sector finances, deficits and per-student funding refer to the English higher education sector and draw on Office for Students financial-sustainability reporting and independent funding analysis; they are cited as external context, may be superseded by more recent releases, and are not derived from the HESA data analysed here. All quantitative estates findings in this report are UK-wide and from HESA sources.
Populations
139 providers reported estates data for 2024/25; 131 of these match to 2024/25 premises finance data; 125 meet the benchmark filters (non-residential floor area above 1,000 m² and more than 500 student FTE). Headline sector figures use the 125-provider set unless stated. The wider finance release covers 299 providers. HESA states that 13 providers did not finalise their 2024/25 financial data by the publication cut-off and will be added in a future update; they are absent from 2024/25 figures, which are therefore understated at sector level.
Participation
Estates Management record participation became optional for providers in England and Northern Ireland from 2019/20, remained optional in Scotland and statutory in Wales. Reporting providers are therefore partly self-selected from that year onwards, and provider counts fall from around 160 to around 139 across the period. Trend statements use matched panels to mitigate this.
Cost Basis
“Premises operating expenditure” means total staff costs plus other operating expenses charged to HESA cost centre 205. It excludes depreciation, amortisation and interest. Staff costs cover directly employed staff only; payments to external contractors and service providers fall within other operating expenses. Other operating expenses is a broad HESA category that can include energy, rates, insurance, contracted services, maintenance and other items; the published data does not separate these. Premises figures relate to the non-residential estate; residences are recorded separately under Finance record Table 8 sub-head 5a. Cost per square metre therefore uses non-residential gross internal area as its denominator.
Trends and Panels
The headline one-year comparison uses a matched panel of 120 providers with complete finance, estates and income data in both years, matched on UKPRN; merged institutions follow the surviving provider’s returns. For context we also report the change across a wider group of around 250 providers reporting premises expenditure in both years, including many smaller and specialist institutions, which shows a shallower fall. The ten-year panel comprises the 95 providers reporting floor area, energy, income, student FTE and scope 1 and 2 emissions in every year from 2015/16 to 2024/25; water and renewable-generation trends use separate matched panels of 116 and 87 providers respectively, comprising all providers reporting that measure in every year. The latest-year renewable-generation change uses the 112 benchmark providers reporting in both years. All monetary growth figures are reported in nominal terms unless stated otherwise. Quartiles are computed by linear interpolation on provider-level values; regional quartiles are suppressed below five providers and flagged below ten. Space per student uses total gross internal area, including residences, and is labelled accordingly. The renewable generation share is aggregate generation divided by aggregate consumption for providers reporting both measures.
Fuel and rating analyses
The fuel decomposition of energy and emissions uses the same 95-provider panel; natural gas includes gas used as input to on-site CHP. DEC/EPC figures describe rated non-residential floor area only: the 2024/25 snapshot covers the 108 benchmark providers reporting all seven bands (rated area equal to roughly 78% of their non-residential estate), and the decade comparison uses the 86 providers reporting complete bands in every year. Staff-share figures are premises staff costs as a share of premises staff plus other operating expenses; the staff line covers directly employed staff charged to the cost centre and does not distinguish roles. HESA’s estates collection includes a field for externally provided property-management costs; that field is not present in the open-data extract analysed for this report.
Variance calculation
For each provider above its own region’s median operating cost per square metre (non-residential basis), the variance is (provider £/m² − regional median £/m²) × provider non-residential floor area, summed across providers; Northern Ireland (three providers) is excluded. It is a descriptive measure of dispersion, not an estimate of recoverable savings for any institution. A full calculation register accompanies this report.
Sources and Notes
Estates and premises finance data: HESA, Estates Management record and Finance record, higher education providers, downloaded 11 July 2026. https://www.hesa.ac.uk/data-and-analysis/estates. Contains HESA data licensed under the Creative Commons Attribution 4.0 International Licence.
Population data: Office for National Statistics, National Population Projections, Population Pyramids (2024-based). https://www.ons.gov.uk/visualisations/dvc3528/fig07/index.html