
THE UK UNIVERSITY ESTATES BENCHMARK 2026
Fixed estate. Tighter budgets. Harder choices.
Cost, space, energy and carbon across 125 HESA-reporting higher education providers
Foreword
We work on university campuses every day, where estates teams are continually looking for ways to improve efficiency, adopt new approaches and get more value from existing facilities and services.
This report looks at what the latest Higher Education Statistics Agency (HESA) data can tell us about how reported premises expenditure is changing, how cost intensity varies between providers, and how the size and energy use of the estate have changed over time. The benchmark calculations use HESA open data; other sources are used for context. No institution is named. Three things stand out.
First, the long-term estate and energy picture. Across a matched panel of 95 providers, floor area was 9.7% larger in 2024/25 than in 2015/16, while total energy consumption was 5.8% lower and reported scope 1 and 2 emissions were 37% lower.
Second, the benchmark shows substantial variation in reported cost per square metre, even among providers in the same region. Third, recent changes in student enrolments have happened against an estate that has changed very little since 2022/23.
This is not a league table. A higher or lower cost per square metre is not, by itself, evidence of good or poor performance. The benchmark highlights differences and helps provoke useful questions about what is driving them.
James Gates, Managing Director, Bidvest Noonan
The Benchmarks: Reported Cost Intensity
Cost management remains a live issue across higher education. In its November 2025 financial sustainability update, the Office for Students said the financial outlook for registered higher education providers in England remained challenging, with recruitment below previous expectations and many providers continuing to face financial pressures.
Against that wider context, this benchmark looks specifically at reported premises expenditure. It compares selected premises expenditure per square metre of non-residential estate across 125 HESA-reporting providers, using the latest reported year.
For each provider, we add two HESA expenditure lines, directly employed premises staff costs and other operating expenses, and divide the total by reported non-residential floor area. We use these two lines because they cover directly employed premises staff and a broad range of other operating costs, including contracted services. Together, they account for around two-thirds of total reported premises expenditure across the benchmark providers.
This is a calculation made for this report, not a separate HESA measure. No institution is identified; positions are shown as regional and size-band quartiles. £/m² figures are rounded to the nearest pound. Full definitions and exclusions are in the appendix.
Last year movement
Across the same 125 providers, the two reported HESA premises expenditure categories moved in opposite directions between 2023/24 and 2024/25.
| Reported HESA premises expenditure | Change 2023/24 to 2024/25 |
|---|---|
| Directly employed premises staff costs | +3.9% |
| Other operating expenses, including contracted services | −3.8% |
The data does not establish whether the movements reflect any shift between insourced and outsourced delivery: the data does not identify whether changes in either category resulted from changes in service-delivery model.
Other operating expenses is a broad category that can include energy, rates, insurance, maintenance, materials and contracted services, so the 3.8% fall cannot be attributed to any one type of expenditure from the published data alone.
HESA notes that reported staff costs can be affected by pension accounting adjustments, so the 3.9% movement is not a direct measure of wage or payroll growth.
By size
| Student FTE | Providers | Lower quartile (£/m²) | Median (£/m²) | Upper quartile (£/m²) |
|---|---|---|---|---|
| Under 5,000 | 21 | 114 | 148 | 185 |
| 5,000-10,000 | 17 | 103 | 138 | 149 |
| 10,000-20,000 | 52 | 125 | 144 | 186 |
| 20,000-40,000 | 33 | 145 | 172 | 208 |
The size bands do not show a simple relationship between provider size and reported cost intensity. Among the four bands with publishable values, the 20,000–40,000 band has the highest median at £172/m², compared with £138–£148/m² across the three smaller bands. Provider size can also be associated with differences in estate type, location and institutional activity.
By region
| Region | Providers | Lower quartile (£/m²) | Median (£/m²) | Upper quartile (£/m²) |
|---|---|---|---|---|
| London | 25 | 185 | 209 | 256 |
| South West | 10 | 134 | 168 | 201 |
| North East * | 5 | 160 | 167 | 172 |
| East of England * | 9 | 124 | 164 | 174 |
| South East | 13 | 143 | 164 | 204 |
| North West | 10 | 135 | 153 | 164 |
| West Midlands | 10 | 135 | 144 | 169 |
| Scotland | 15 | 110 | 136 | 180 |
| East Midlands * | 7 | 117 | 127 | 136 |
| Yorkshire and The Humber | 10 | 111 | 124 | 130 |
| Wales * | 8 | 90 | 122 | 134 |
| Northern Ireland ** | 3 | – | . | . |
The Providers column sums to the 125 benchmark providers in total. Northern Ireland (3 providers) is shown for completeness but its values are suppressed and excluded from the variance calculations. * Small sample (fewer than ten providers). ** Values suppressed (fewer than five providers); included in provider counts only, and excluded from the variance calculations.
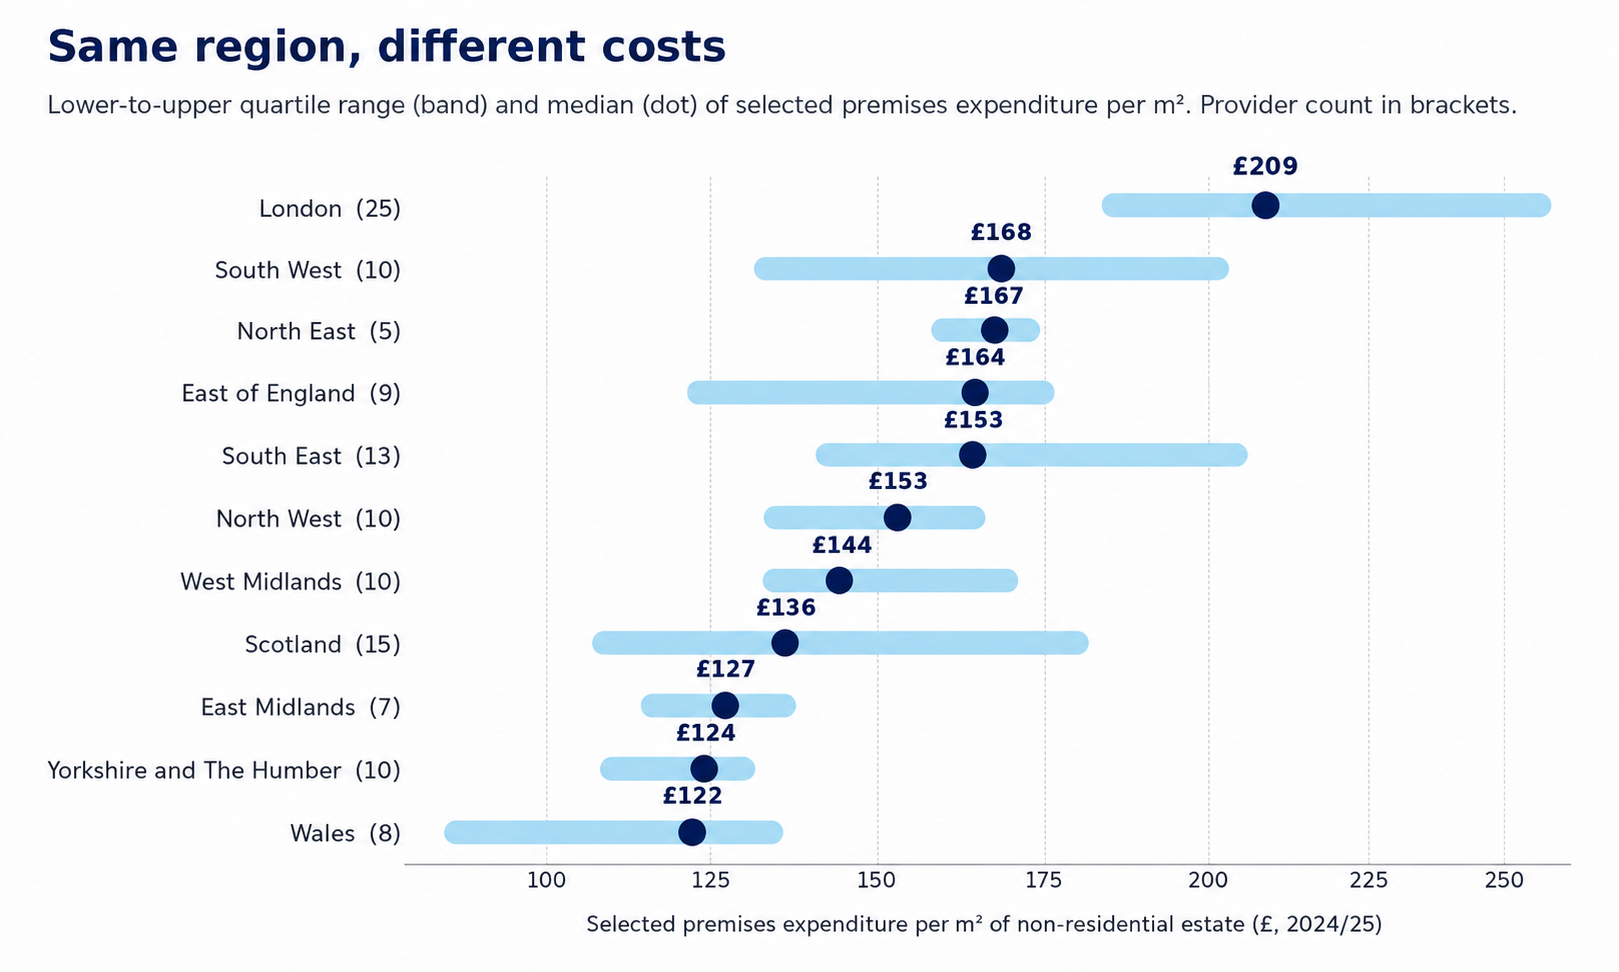
Source: HESA Estates Management and Finance records (downloaded 11 July 2026); 125 benchmark providers, 2024/25. Regions with fewer than five providers are excluded.
Two features stand out. London has the highest median reported cost intensity at £209/m², compared with £141/m² across providers outside London. There is also substantial variation within regions: in eight of the eleven regions for which values are shown, the upper quartile is at least 20% higher than the lower quartile.
The regional figures show where differences exist; they do not explain what causes them. Building type, location, institutional activity, service scope and operating model may all affect an individual provider’s position.
Practitioner Perspective: Understand the drivers, act on what can change
Cost per square metre varies widely even between providers in the same broad region. Universities can arrive at similar £/m² figures through very different operating models, estate conditions and service choices, which is why the number is a useful starting point for investigating opportunities for improvement.
When an estate looks more expensive than its peers, it can be worthwhile digging into the numbers to understand what is driving the difference. How much is structural, such as laboratory and specialist space, heritage buildings, dispersed sites or longer operating hours? How much reflects the scope or specification of services the institution has chosen? And how much is operational, where deployment, coordination or service design could be changed? The operational element is the part most directly open to improvement.
Once the drivers are understood, it is useful to look at how services are designed and delivered. In our work with universities, that has included reviewing specifications, deployment patterns and working practices to identify where resources can be used more effectively without compromising the outcomes the institution needs.
Innovation can support that process through better use of data, smarter deployment and, increasingly, automation. Large-area floor cleaning is one example where automated equipment can provide consistent delivery while allowing people to focus on work that requires judgement, interaction or specialist skills. The value is not in automation for its own sake, but in using technology where it can make the service more efficient, responsive and consistent.
Mairead Stapleton, Senior Business Development Director, Higher Education, Bidvest Noonan
The Fixed Estate: Enrolments Changed Faster than the Floor Area
Across the matched panel of 95 providers, total gross internal area was 9.7% higher in 2024/25 than a decade earlier. Since 2022/23, however, it has been broadly unchanged, increasing by just 0.7%. Separately, HESA reports that sector student enrolments peaked in 2022/23 and fell in each of the following two years. These figures use different populations and are presented together as context, not as a causal comparison.
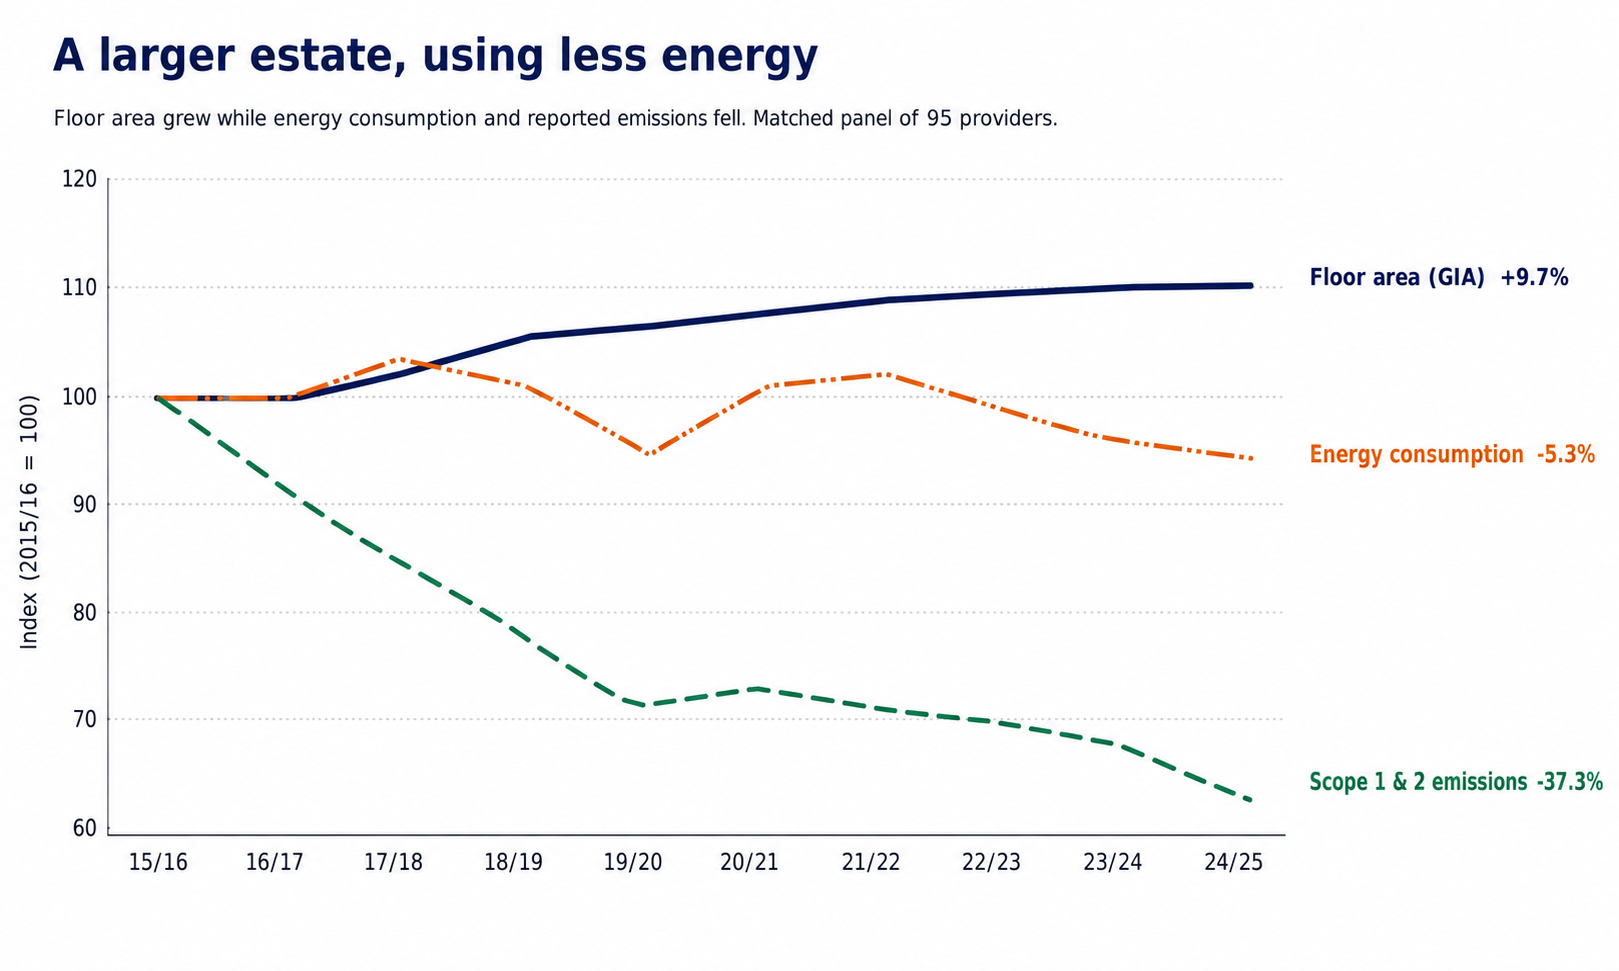
Source: HESA Estates Management record open data (downloaded 11 July 2026); matched panel of 95 providers reporting all measures in every year.
HESA reports that overall entrant enrolments fell by 1% in 2024/25. Postgraduate taught entrant enrolments fell by 5%; within that total, entrants with a non-EU permanent address fell by 10% and EU entrants by 8%, while UK entrant numbers were broadly unchanged. First-degree enrolments moved in the opposite direction, rising by around 1% from 1.898 million to 1.921 million.
Energy: a decade of measurable progress
Across the matched panel, the estate is larger than a decade ago while total energy consumption is lower.
Across the matched panel of 95 providers, total energy consumption fell 5.8% while floor area grew 9.7%, taking energy intensity from 263 to 226 kWh per m². Reported scope 1 and 2 emissions fell 37% over the same period.
Gas is the part that has changed very little. Gas consumption was broadly unchanged over the decade, down 0.3%, compared with a 5.8% fall in total energy consumption.
Practitioner Perspective: Match Services & Investment to how the Estate is Actually Used
The physical footprint of a university estate can change relatively slowly, while the way it is used can change much faster. Enrolments, timetables and departmental activity move, but buildings still need to be cleaned, secured, maintained and supported. That makes it increasingly important to understand where activity is actually taking place and whether services remain aligned with it.
For soft services in particular, better information can support much more precise deployment. Occupancy and other sensor data can help show where and when buildings are actually being used, allowing cleaning frequencies, security presence and other support services to respond more closely to demand rather than fixed assumptions. Capturing that information over time also creates a stronger basis for adjusting service levels as patterns change.
The same evidence can inform energy and maintenance decisions. Understanding how buildings are being used can help estates teams align heating, ventilation and run-times more closely with demand, identify where operational changes are possible and build a clearer case for where investment is genuinely required.
Over time, bringing together utilisation, service data, building condition and energy performance can create a stronger basis for both service design and capital planning. It can help teams distinguish between improvements that can be made through day-to-day operations and those that genuinely require investment.
The opportunity is to manage the estate as a connected system rather than as separate cleaning, security, maintenance and energy programmes. Better evidence can help universities deploy services more effectively today while making better-informed decisions about the estate they will need tomorrow.
Peter Smyth, Director of Technology & Innovation, Bidvest Noonan
Five questions for your next estates conversation
- Where does our reported cost per square metre sit against our regional and size-band quartiles, and do we understand what is driving the difference?
- How did the staff-cost and other-operating-expense components of our reported premises costs change last year, and what explains the movement?
- If we redesigned cleaning, security and other support services around how the campus is actually used today, what would we do differently?
- What information are we missing that would allow us to deploy services more intelligently, and could sensors or other technology provide it?
- Which repetitive, high-volume activities could we automate, and how would we use the capacity that automation releases?

Appendices: Methodology & Technical Notes
Sources and Date
The analysis uses HESA open data downloaded on 11 July 2026: the Estates Management record for floor area, energy and emissions from 2015/16 to 2024/25, and Finance Table 8, cost centre 205 (Total premises), for 2023/24 and 2024/25. Student figures are taken from HESA’s published 2024/25 student statistics. HESA data is licensed under CC BY 4.0; all calculations and interpretations in this report are our own.
Benchmark Population
The benchmark covers 125 higher education providers with the required Estates Management and Finance data, more than 1,000 m² of non-residential floor area and more than 500 student FTE. The current benchmark and latest-year expenditure comparison use these 125 providers. Ten-year estate, energy and emissions trends use a matched panel of 95 providers reporting the required measures in every year from 2015/16 to 2024/25.
Cost Basis
Cost per square metre is calculated for this report by adding two HESA Finance Table 8 lines for cost centre 205, staff costs and other operating expenses, and dividing by non-residential gross internal area. It is not a separate HESA expenditure measure. Staff costs relate to directly employed staff; contracted services are included within other operating expenses. Depreciation and amortisation are reported separately and are excluded. Residences are also excluded.
Comparisons
Regional and size-band figures are quartiles of provider-level £/m² values. Small groups are identified or suppressed as shown in the tables. Trend figures use matched panels to reduce the effect of changes in reporting participation. Estates Management participation and item completion are not uniform across the UK, so the results should not be read as a census of the sector.
Gas
Gas consumption uses the same 95-provider matched panel and includes natural gas used as input to on-site CHP.
Sources and Notes
Estates and premises finance data: HESA, Estates Management record and Finance record, higher education providers, downloaded 11 July 2026.
https://www.hesa.ac.uk/data-and-analysis/estates
Student numbers: HESA, Higher Education Student Statistics: UK, 2024/25, “How many students are in higher education (HE)?”, published 27 January 2026.
https://www.hesa.ac.uk/news/27-01-2026/sb273-higher-education-student-statistics/numbers
Postgraduate taught entrants: HESA, Higher Education Student Statistics: UK, 2024/25 (Statistical Bulletin SB273), published 27 January 2026.
https://www.hesa.ac.uk/news/27-01-2026/sb273-higher-education-student-statistics
Financial sustainability: Office for Students, Financial sustainability of higher education providers in England 2025, Ref. OfS 2025.26, published 8 May 2025.
https://www.officeforstudents.org.uk/media/upycgog5/ofs-2025_26_1.pdf